
A Summary: Access to Nutrition Initiative: U.K. Product Profile 2019
Aims:
- Overview of ‘healthiness’ of the products
- Extent to which the products would be able to be marketed to children
Overview:
Over 3000 UK products were surveyed and analysed using the Australian Health Star Rating (HSR) and World Health Organisation (WHO) Europe Nutrient Profile Model (NPM). Sales data from 2016 found that these products accounted for 50% of the sales of packaged food. Of the products surveyed, 69% failed to meet the healthy standard of 3.5 on the HSR (average 2.2 HSR for food, average 2.8 HSR for beverages), whilst 85% would be unsuitable to market to children.
Data:
The Access to Nutrition Report analysed over 3000 food and beverage products in 18 UK manufacturers’ 5 bestselling food and beverage categories (data extracted from Euro monitor International’s industry publications of: Packaged Food 2018, Soft Drinks 2018 and Hot Drinks 2018). These products accounted for 49% of the sales of packaged foods and beverages in 2016. 10 companies surveyed had 100% of their sales covered, 5 had above 80% and 2 had between 60% and 70% (due to infant formulas and baby foods, plain tea and coffee being excluded).
It did not include the same product in a different serving size; all products had to be unique. Products with data entered or updated from 2013 onwards were extracted from U.K. FoodSwitch database. In September 2017, companies were given the opportunity to check the data and make any corrections or additions. 10 out of 18 companies (Coco-Cola, Danone, Ferrero, General Mills, Grupo Bimbo, Kellogg, Mondelex, PepsiCo , Unilever and Mars) accepted this request.
The Health Star Rating (HSR) and World Health Organisation (WHO) Nutrient Profiling Model (NPM) were used to assess the healthiness of products in the study. Proxy values for fruit, vegetables, nuts, legumes and fibre where data was not available, was taken from the database developed by TGI. A standard proportion of total sugar was used to calculate free sugars. Some companies provided this data so proxy values were not needed for all.
3,192 products were assessed using the WHO NPM, 3,069 products were assessed using HSR (there was insufficient nutrition information for some products to be assessed).
Products excluded: unprocessed meat, poultry, fish and plain cereals (as they were not required to carry a nutrient declaration); plain tea and coffee, and condiments such as herbs, salt, per, vinegars and spices (as they have low nutritional contribution and not required to display a nutrient declaration); infant formulas, supplements and baby food and beverages (as they are not consumed by the general population and no appropriate for evaluation).
Categories included
|
Categories |
Companies |
|
Dairy |
Arla, Danone, Friesland Campina, General Mills, Lactalis, Mondelez, Nestle, Unilever |
|
Ice Cream + Frozen Desserts |
General Mills, Mars, Nestle, Suntory, Unilever |
|
Sauces, dressings and condiments |
Ajinomoto, Kraft Heinz, Mars, Unilever |
|
Baked Goods |
Ferrero, General Mills, Grupo Bimbo, Mondelez |
|
Confectionery |
Ferrero, Mars, Mondelez, Nestle |
|
Sweet biscuits, snack bars + fruit snacks |
General Mills, Kellogg, Mars, Mondelez |
|
Breakfast Cereals |
Kellogg, Nestle, PepsiCo |
|
Bottled Waters |
Coca-Cola, Nestle, PepsiCo |
|
Carbonates |
Coca-Cola, PepsiCo, Suntory |
|
Sports + Energy Drinks |
Coca-Cola, PepsiCo, Suntory |
|
Spreads |
Ferrero, Kraft Heinz, Unilever |
|
Rice, pasta and noodles |
Ajinomoto, Mars, Unilever |
|
Juice |
Campbell, PepsiCo, Suntory |
|
Soups |
Campbell, Kraft Heinz |
|
Ready Meals |
General Mills, Kraft Heinz |
|
Savoury Snacks |
Kellogg, PepsiCo |
|
Processed fruit + vegetables |
Kraft Heinz |
|
Other hot drinks |
Mondelez |
|
Concentrates |
Suntory |
Results
Product Profile Scores (Maximum 10)
“To generate each company’s initial score, the mean Health Star Rating for each of its categories is weighted by the corresponding 2016 UK sales value figure (data extracted from Euromonitor International’s industry publications of: Packaged Food 2018, Soft Drinks 2018 and Hot Drinks 2018). The maximum initial score is 5 (because this is the maximum possible rating on the HSR for any individual product). The Product Profile score is simply this figure doubled, so that it is scored out of ten to be comparable to other countries’ data, which is presented this way. A score of 10 on the Product Profile would indicate that a company’s whole portfolio comprised products and/or sales of products with the maximum HSR of 5. Companies are then ranked on the basis of these scores”
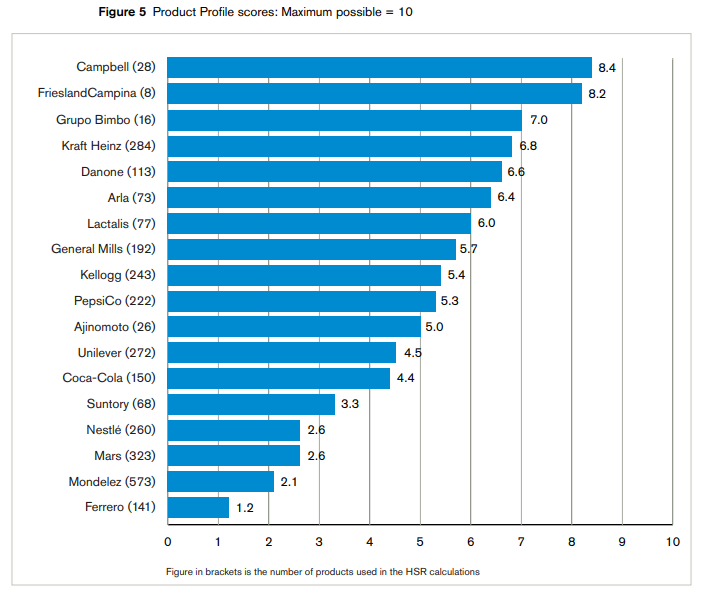
(Graph taken from the access to nutrition initative: u.k product profile 2019 report)
The variation could be due to companies offering different types of products offered within each category and the number of products surveyed within each company. The three highest product profile scores had a low number of products surveyed in each company (Campbell, 28, FrieslandCampina, 8, Grupo Bimbo, 16).
Health Star Rating
|
Categories |
Mean HSR |
Company with the highest HSR |
Company with the lowest HSR |
|
Confectionery |
0.8 |
Mars (0.9) |
Ferrero (0.6) |
|
Other hot drinks |
1.3 |
Nestle (2.2) |
Mondelez (0.5) |
|
Spreads |
1.3 |
Kraft Heinz (2.0) |
Ferrero (0.5) |
|
Sports and energy drinks |
1.5 |
Coca-Cola (1.8) |
PepsiCo (1.0) |
|
Baked Goods |
1.6 |
Grupo Bimbo (3.5) |
Mondelez (1.0) |
|
Ice cream and frozen desserts |
1.7 |
Suntory (3.0) |
Unilever and Mars (1.7) |
|
Sweet biscuits, snack bars and fruit snacks |
1.8 |
General Mills (2.5) |
Mars and Mondelez (1.4) |
|
Carbonates |
1.8 |
Suntory (2.5) |
PepsiCo (1.6) |
|
Concentrates |
1.9 |
Coca Cola, Suntory (1.9) |
N/A |
|
Savoury snacks |
2.2 |
PepsiCo (2.4) |
Kellogg (2.0) |
|
Sauces, dressings and condiments |
2.7 |
Mars (3.4) |
Ajinomoto (1.7) |
|
Bottled water (including flavoured) |
3.1 |
Danone (3.5) |
Nestle (2.0) |
|
Dairy |
3.1 |
FrieslandCampina (4.1) |
Nestle (2.8) |
|
Ready meals |
3.2 |
Kraft Heinz (3.5) |
General Mills (2.5) |
|
Breakfast Cereals |
3.4 |
PepsiCo (4.0) |
Kellogg (3.2) |
|
Soups |
3.5 |
Kraft Heinz (3.5) |
Campbell (3.4) |
|
Rice, pasta and noodles |
3.6 |
Ajinomoto (3.9) |
Unilever (3.2) |
|
Juice |
4.0 |
Campbell (5.0) |
Suntory (1.7) |
Only one company sold products in the category ‘processed fruit and vegetables’ so it was omitted
WHO Europe Nutrient Profile Model
|
Categories |
Company with the highest percentage of products that would meet the criteria to market to children |
Company with the lowest percentage of products that would meet the criteria to market to children |
|
Confectionery |
N/A |
Ferrero, Mars, Mondelez, Nestle (0%*) |
|
Other hot drinks |
Mondelez (5%) |
Nestle (0%) |
|
Spreads |
|
|
|
Sports and energy drinks |
N/A |
Coca-Cola, PepsiCo (0%) |
|
Baked Goods |
|
|
|
Ice cream and frozen desserts |
N/A |
General Mills, Mars, Suntory, Unilever (0%*) |
|
Sweet biscuits, snack bars and fruit snacks |
N/A |
Ajinomoto, General Mills, Kellogg, Mars (0%*) |
|
Carbonates |
Coca-Cola (7%) |
PepsiCo, Suntory (0%) |
|
Concentrates |
N/A |
Coca-Cola, Suntory (0%) |
|
Savoury snacks |
N/A |
Kellogg, Pepsico (0%*) |
|
Sauces, dressings and condiments |
|
|
|
Bottled water (including flavoured) |
Nestle (100%) |
Coca-Cola (27%) |
|
Dairy |
Friesland Campina (50%) |
Nestle (1%) |
|
Ready meals |
|
|
|
Breakfast Cereals |
Nestle (27%) |
PepsiCo (19%) |
|
Soups |
|
|
|
Rice, pasta and noodles |
Ajinomoto (100%) |
Unilever (85%) |
|
Juice |
N/A |
Coca-Cola, Danone, PepsiCo, Campbell, Suntory (0%) |
*”WHO Europe model considers no confectionery, ice cream and frozen desserts, savoury snacks or sweet biscuits, snack bars and fruit snacks being suitable to market to children”
Statistics
85% of products were unsuitable to be marketed to children based on the analysis using the WHO model. Of the 15% that would have been able to be marketed, it was estimated that the companies had generated just 11% of their sales to those products.
Campbell had 71% of products eligible to be marketed to children compared to 0% of Suntory and Ferrero. 16 of the companies had 50% or less products eligible to be marketed to children.
69% of products analysed using HSR failed to meet the healthy standard (3.5 out of 5). The average HSR for food was 2.2, and for beverages was 2.8.
The nutritional quality varied substantially in each category showing reformulation is possible for the food and drink beverages with the higher levels of salt, sugar and fat.
Limitations:
Whilst the companies were offered to validate the data and provide missing data, some companies did not, so some data may not be accurate and proxy data had to be used for missing data such as for FVNL and fibre. The use of proxy data could underestimate the real differences between companies. The data was also for products on the market in 2016, therefore products may have changed since then (better or worse).
The study size was limited due to resources, therefore not all categories were covered in all companies, and only the largest manufacturers in the UK were studies (accounting for 49% of the total U.K food and beverage sales in the UK). Therefore, some smaller manufacturers were omitted including foods made by retailers, café, restaurants and food service sectors, which account of an increasing amount of consumption.
The sales data was extracted from Euromonitor International’s industry publications of Packaged Food 2018, Soft Drinks 2018 and Hot Drinks 2018, rather than submitted by the companies therefore category sales data was used rather than product sales data.
WHO Europe Model was used to products suitability to market to children as it allowed comparison to other countries data generated using the WHO model, and the UK’s NPM did not meet the criteria adopted by ATNI’s Expert Group. Evaluations of NPMs are always ongoing to see how they could be improved.
The NPMs do not take into account serving sizes, however there is no agreed set serving size standards national or international to be able to be taken into account.
Impact and Recommendations:
To Food and Beverage Manufacturers:
- Reformulate products
- Improve the category and product mix (increase the proportion of healthier products)
- Adopt a stringent nutrient profiling system
- Stop marketing to children products that are not healthy, as assessed by a NPM, across all media, in store and on packaging
- Increase the proportion of marketing dedicated to healthy products
- Take a structured approach to address nutrition, based on SMART targets
- Improve accountability through better annual reporting (i.e include the proportion of products eligible for marketing to children)
To Investors:
- Carefully asses the risks and opportunities related to nutrition and engage actively with companies on product reformulation, marketing policy and practices, pricing, distribution and reporting
- Adopt policies that have been consulted on to create a food environment that drives improvement in the healthiness in packaged foods and beverages in the UK market.
- Make healthier products accessible and affordable
Policymakers:
- Adopt policies that have been consulted on to create a food environment that drives improvement in the healthiness in packaged foods and beverages in the UK market.
- Make healthier products accessible and affordable
To view the Access to Nutrition Initiative report click here
To see more about the WHO Europe NPM click here
To see more about the Australian HSR click here
